A Comprehensive Analysis Method
Case Study 1.1
How Emergent BioSolutions Increased Sales By 11% Per Month

When Emergent BioSolutions, a developer and manufacturer of medical countermeasures, approached Graphcom to develop a marketing campaign for its first civilian product line, we proposed comprehensive analytics to measure success and deliver a strong ROI. For the first time, Emergent made the RSDL (Reactive Skin Decontamination Lotion) Kit available for purchase to the United States civilian audience. That’s where Graphcom came in.
The Challenge
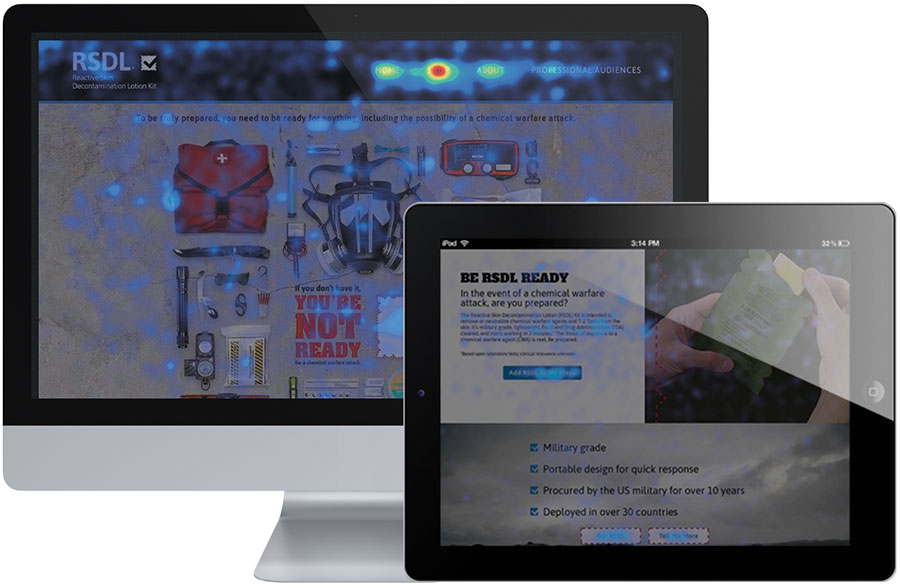
We launched a comprehensive RSDL marketing campaign, which included a website, email blasts, Amazon PPC ads, sales team collateral tools, web ads, print ads, and Key Opinion Leader outreach kits to direct the audience to the website and convert them into paying customers through an Amazon product page. To measure the success of this campaign, we needed to analyze and report on each marketing piece created as efficiently and holistically as possible.

The Solution
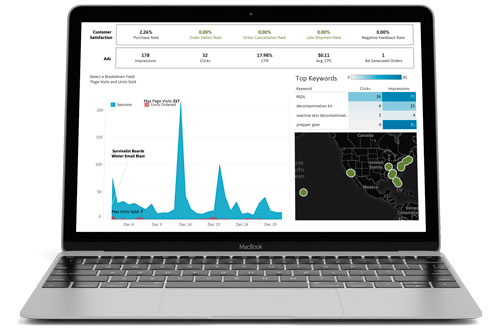
First, we identified key performance indicators for website metrics we wanted to measure, and then determined what marketing pieces we wanted to track to collect the data we needed. Once these elements were in place, we then developed an interactive digital dashboard through Tableau to display the cohesiveness of the campaign and how it’s working to drive consumers to a sale. After the creation of the dashboard, we needed to create means of tracking for the data sources that were chosen.
We then created URLs with a unique UTM code for each web ad that directs users to the website, and custom URLs for print ads that redirect to the website. A UTM code is a piece of code that is embedded into a URL to track where users came from when clicking on the URL. We also set up our user experience tracking software on each webpage, which uses heat mapping and live screen recordings to track user behavior. Together, these two elements allowed us to track clicks and identify trends of where users were coming from and how they were interacting with the website.
The Results
After four months of collecting and analyzing the data gathered, we began to pinpoint successful marketing pieces, understand trends and patterns of user behavior on the website, define a buyer’s journey, and intelligently provide recommendations for future marketing tactics based on concrete data.
Key Takeaways
%
of all website visitors clicked on a purchase call to action, which directs to the Amazon product page.
97% of the clicks happened on the home page. This indicates that users with the intent to purchase engage most with the home page. Knowing this, we can optimize the home page to incorporate more information about purchasing the product for a better shopping experience.
%
of all website users arrived through a Google AdWords campaign, the leading traffic source each month since the campaign began.
Through audience analysis and competitor research, we identified marketing tactics that could increase reach and engagement. By focusing on keywords that relate to the target audience, we’ve been able to increase site traffic by 19.22% using Google AdWords.
%
of all desktop visitors reached the footer of the home page, and 53.64% reached the footer of the about page.
Typically, only 25% of users scroll to the bottom of the page, and 75% make it past the average page fold. This indicates that most website visitors find both pages useful and informative, so we felt confident putting relevant content below the fold of each webpage for visitors to interact with it.
What’s Next?
Each month, after a thorough examination of our interactive dashboard and user experience data, we provide a comprehensive analysis to our client, complete with recommendations to evolve our marketing outreach and success.
Month over month, we work together to identify what’s working to increase visibility and engagement, and what isn’t—ensuring that every dollar Emergent BioSolutions spends on marketing drives product sales.
Since the launch of the website, there was a
%
increase in total site visitors and
%
increase in average time spent on page month over month.
Want Results Like These, Too?
Let’s talk. Together, we’ll analyze your marketing campaign and deliver better results.