Data Analytics
What We Offer

Get the highest return from your donation websites and forms with intelligent A/B testing. We can test everything from colors and buttons to fonts and form fields to optimize user experience and maximize conversions. By understanding donor behavior, we develop strategies that resonate with your audience and drive specific campaign goals, like increasing recurring giving revenue.
Campaign analytics can help simplify the gift process by identifying and eliminating noise so you can focus on the information that matters. Additionally, we can use testing to evaluate campaign copy and creative design and ensure your message hits home every time.
We don’t just deliver insights—we present them in a way that’s impactful and actionable. Our Tableau dashboards transform complex data into easily digestible formats, perfect for sharing during your leadership or board meetings. Each dashboard is branded and customized to your unique needs and goals.
Here are just a few benefits of our dashboards:
50%
Consistent data auditing can reduce data errors by 50%*
*Source: National Library of Medicine Study
Donor segmentation and personalization should be at the heart of all fundraising efforts. But, many healthcare organizations struggle to define their donors and how to target more people like them.
We offer a solution. Our data team conducts comprehensive audits of your constituent database to develop detailed donor personas. With this knowledge, we can grow your network of supporters by identifying and engaging potential new donors who share similar attributes. If you don’t have substantial constituent data available, we offer a number of resources that can be used to enhance your list.
We tailor your communications to resonate with each group’s distinct preferences and motivations for giving. We consider age, location, family status, employment, and service line or specialty interests to craft more targeted—and successful—fundraising appeals and other materials. Database audits are ideal for optimizing outreach efforts, reducing costs, finding gaps in data, cleansing data to improve communications, and fostering deeper connections with donors. This also allows us to understand what data is available to influence future variable messaging.
400%
Better user experience (UX) design based on testing results can increase conversion rates by 400%*
*Source: Entrepreneur
Strategic benchmarking can elevate the effectiveness, efficiency, and long-term sustainability of your fundraising. Graphcom can help you assess your performance and progress toward your organizational mission and vision.
Industry-wide philanthropic benchmarks offer valuable insights, but it’s equally important to gauge your own organization’s progress over time. By analyzing recurring gifts and communications performance year over year, we help you understand where you currently are and set feasible goals for the future.
We use these insights to allocate resources effectively, whether it’s prioritizing donor retention, acquiring new supporters, or nurturing them up the giving pyramid. We’ll positively impact your bottom line and propel your philanthropy based on our findings.
Examples of data points that are helpful to benchmark year-over-year include:
- Engagement rates via various channels
- Retention rates
- Acquisition rates
- Dollars raised
- Cost per dollar raised
760%
Emails using segmentation and personalization result in a 760% revenue increase compared to those that didn’t utilize segmentation*
*Source: Campaign Monitor
77%
Revenue per donor of a recurring donor is 77% greater than a non-recurring donor.*
*Source: NextAfter/Salesforce
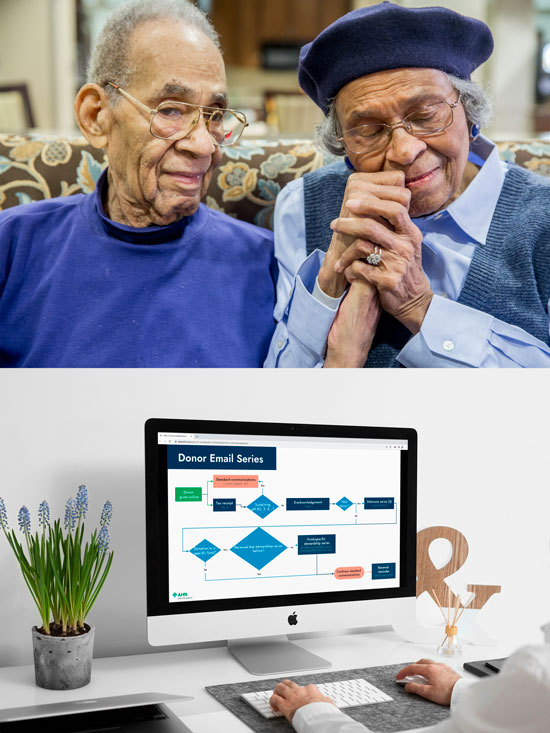
See the Power of Our Tableau Data Analytics Dashboards
We transformed data insights into action and helped these clients make more informed decisions with every touchpoint.
Customized Insights
No templates here! Handpick the variables, demographics, and insights that matter most to you. From cost per dollar raised and response rates to gifts by channel such as direct mail or email, these insights are what you need to elevate your efforts. If you have the data, we can report on it. If you don’t have the data, we can work with you to develop a strategy to collect it.
Performance Snapshot
Quickly see summarized results for your appeal without having to do any additional calculations.
Interactive
Dive deeper into your data with Tableau’s interactive filters, so you focus only on the specific demographics and information relevant to your goals.
Testing Insights
Our dashboards include detailed reports on A/B testing results, including statistical significance. Whether you’re comparing performance by hospital or evaluating donor segments, your key insights are available at a glance.
Long-term Strategy
Get a holistic view of your campaigns’ performance year-over-year. Our dashboards show results for individual campaigns, overarching trends, strategic insights, recommendations, and more.


Let’s Work Together
Get started on your next great fundraising campaign. Fill out the form below, and we’ll connect with you soon.